Architecture
Architecture documentation. The Add-on follows classical model-view-controller pattern.
ToDo list for the project:
- Additional support for NeuroML, NineML and SpineML
- Provide additional information about network in the GUI
- Allow for more biologically sound axon curvatures
Model
The model consists of the classes that represent an actual network:
- Cells
- Connections between them (Projections)
- Populations of cells
- Networks
as well as description language specific classes and helper classes, like ColorMap.
High level model
-
class
neuron_visualization_addon.model.Network.Network(id)[source]¶ Bases:
objectThis class represents a network. Network consists of populations and projections between them.
-
animateSpikes(spikes, colorMap='jet', animateAxons=True)[source]¶ Animate network.
Parameters: spikes (dict) – Dictionary of cell IDs as keys and a tuple of time and intensity as values
-
highlightPopulation(population_id)[source]¶ Highlights a population with a random color.
Parameters: population_id (string) – The population ID.
-
location¶ Location of the center of mass.
-
pullProjections(populationID_1, populationID_2, strength)[source]¶ Pull projections between two populations.
Parameters: - populationID_1 (string) – First population ID
- populationID_2 (string) – Second population ID
- strength (int) – Pulling strength
-
-
class
neuron_visualization_addon.model.Population.Population(id, size, cell_type)[source]¶ Bases:
objectThis class represents a population of brain cells in the network
-
location¶ Location of the center of mass.
-
-
class
neuron_visualization_addon.model.Cell.Cell(id, location=(0, 0, 0))[source]¶ Bases:
objectThis class represents a brain cell in the network
-
drawAxon(weight, destinationCell)[source]¶ Draw an axon between this cell and destination cell.
Parameters: - weight (float) – The weight of a connection.
- destinationCell (Cell) – Projection destionation cell.
Returns: Projection – Created projection
-
isProjectedTo(projection)[source]¶ Add projections from which the input is received.
Parameters: projection (Projection) – Projection to be added
-
location¶ Location of the cell.
-
setSpike(time, intensity, colorMap='jet', animateAxons=True)[source]¶ Set cell to spike at a time with a specific intensity
Parameters: - time (float) – Frame of a spike
- intensity (float) – Intensity of a spike from 0 to 1
- colorMap (string) – Color map for intensities Visualization
Todo: Neuron swelling without axon
-
-
class
neuron_visualization_addon.model.Projection.Projection(parent_object)[source]¶ Bases:
objectThis class represents a projection between neurons in the network
-
bevel_objects= {}
-
curve_taper= None
-
destination¶ Destination of the projection (receiving soma)
-
makeProjection(weight, projection)[source]¶ Make projection from defined bezier curve.
Parameters: - weight (array) – Weight of the connection
- projection – Array of bezier points
-
makeSimpleProjection(weight, destination)[source]¶ Make simple projection: straight line between parent object and destination object.
Parameters: - weight (float) – Weight of the connection
- weight – Weight of the connection
-
middle¶ Middle of the projection
-
pullCenterTo(destination, pull)[source]¶ Pull center of the projection to a specific position
Parameters: destination – Where to pull project to
-
spike(time, minColor, maxColor)[source]¶ Propagate potential from parent cell to receiving cells
Parameters: - time (float) – Where to spike
- minColor (tuple) – Color for resting state
- maxColor (tuple) – Color for a spike
-
start¶ Start of the projection (soma).
-
taper= None
-
NeuroML2 model
-
class
neuron_visualization_addon.model.NetworkNeuroML2.NetworkNeuroML2(network, scale=10, loaded_cells={})[source]¶ Bases:
neuron_visualization_addon.model.Network.NetworkThis class represents a network read from NeuroML file.
-
class
neuron_visualization_addon.model.PopulationNeuroML2.PopulationNeuroML2(population, scale=10, loaded_cells={})[source]¶ Bases:
neuron_visualization_addon.model.Population.PopulationThis class represents a population of brain cells in the network based on NeuroML2
-
class
neuron_visualization_addon.model.CellNeuroML2.CellNeuroML2(cell, scale=10)[source]¶ Bases:
neuron_visualization_addon.model.Cell.CellThis class represents brain cells in the network parsed from NeuroML2 files
-
bevel_objects= {}
-
draw_segment(size, bezier)[source]¶ Draw segment of the cell of given size and bezier points
Parameters: - size (float) – Segment size or connection radius
- bezier (list) – List of bezier points [(control, handle_left, handle_right)]
-
location¶ Location
Parameters: location (Vector | tuple) – Cell location
-
make_soma(size, location)[source]¶ Make soma of the cell
Parameters: - size (float) – Soma size / radius
- location (Vector | tuple) – New location
-
Helper classes
-
class
neuron_visualization_addon.model.ColorMap.ColorMap[source]¶ Bases:
objectColor map for the animation
In order to augment the list of color maps, define your own function within this class and add it to the mapsList dictionary
Parameters: mapsList (list) – list of available maps -
getColor(colorMap='jet')[source]¶ Return the color that corresponds to the intensity in a specified color map
Parameters: - intensity (float) – Firing intensity between 0 and 1
- colorMap (string) – color map
Returns: tuple – rgb color
-
jetColor()[source]¶ Calculates jet color based on firing intensity
Parameters: intensity (float) – Firing intensity between 0 and 1 Returns: tuple – rgb color
-
mapsList= {'jet': <function ColorMap.jetColor at 0x000002497C725400>}
-
View
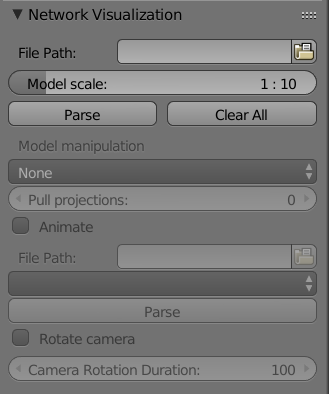
The view consists of classes that are responsible for generating UI. Currently, the only view that is available is the Blender Panel. It consists of the MainPanel class and helper classes.
Blender Panel
-
class
neuron_visualization_addon.__init__.MainPanel(*args, **kwargs)[source]¶ Main panel that the user sees
-
bl_idname= 'MainPanel'
-
bl_label= 'Network Visualization'
-
bl_region_type= 'TOOL_PROPS'
-
bl_space_type= 'VIEW_3D'
-
-
class
neuron_visualization_addon.__init__.PanelSettings(*args, **kwargs)[source]¶ Class of panel elements
Parameters: - networkFileUpload – string filepath to model or animation file
- cameraRotation – boolean that indicates whether camera should be rotated
- populationsDropdown – dropdown of population IDs
- colorMapDropdown – dropdown of available color maps
- parser – pointer to the parser instance
- pullProjections – int that indicates whether the projections between populations should be pulled
-
animate¶ Used by autodoc_mock_imports.
-
animateAxons¶ Used by autodoc_mock_imports.
-
cameraRotation¶ Used by autodoc_mock_imports.
-
cameraSpeed¶ Used by autodoc_mock_imports.
-
colorMapDropdown¶ Used by autodoc_mock_imports.
-
modelScale¶ Used by autodoc_mock_imports.
-
networkFileUpload¶ Used by autodoc_mock_imports.
-
parser= <neuron_visualization_addon.controller.Parser.Parser object>
-
populationsDropdown¶ Used by autodoc_mock_imports.
-
pullProjections¶ Used by autodoc_mock_imports.
Controller
The controller is responsible for changing the model depending on user input.
Parser
-
class
neuron_visualization_addon.controller.Parser.Parser[source]¶ Bases:
objectThis class represents a brain cell in the network
-
adjustCameraSpeed(velocity=100)[source]¶ Adjust camera rotation velocity
Parameters: velocity (int) – Rotation speed in frames
-
colorMaps¶ List of color maps
-
highlightPopulation(populationID)[source]¶ Hightlight a population
Parameters: populationID (string) – population ID which to be highlighted
-
loadCellsNeuroML2(dirpath, includes, scale)[source]¶ Load cells from neuroml2
Parameters: - dirpath (string) – path to include directory
- includes (list) – list of included files
- scale (int) – Scale of a model (DEFAULT: 1:10)
Returns: dict – dictionary of Cell objects
-
parse(filepath, scale, colorMap, animateAxons)[source]¶ Parses nml files
Parameters: - filepath (string) – file to be parsed
- scale (int) – Scale of a model (DEFAULT: 1:10)
- colorMap (String) – Color map for animation
Todo: Include support for more description languages
Returns: string – indicate what was parsed
-
populations¶ List of IDs of all populations
-